Flavorprint: Redefining Recipe Discovery
How do you make the taste of a recipe visible at a glance?
- Client
- McCormick
- Agency
- R/GA
- Role
- Creative Director
- Project recognition
1 award
- Cannes LionsSilver Cyber Lion, Bronze Cyber Lion
- Responsibilities led
- Visualization system designModel dataset developmentColor researchPrototypingUser testingKey view design
Overview
Flavorprint set out to help people discover recipes by flavor. The challenge was a visualization system that could show a recipe’s flavor profile at a glance: accurate enough for the food scientists behind it, simple enough for anyone deciding what to cook.
The challenge: flavor is hard to describe
McCormick had an extensive flavor taxonomy built on years of food science research, but translating it into something people could use to choose a recipe was a challenge. How do you help people navigate taste, preference and experimentation without overwhelming them?
Start with a model dataset
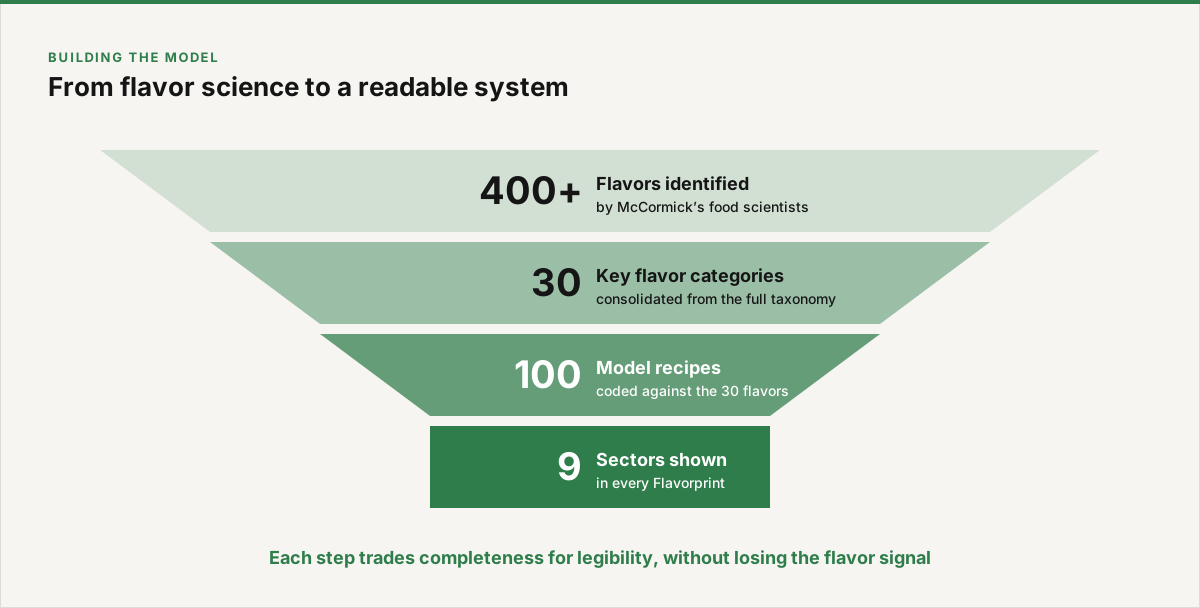
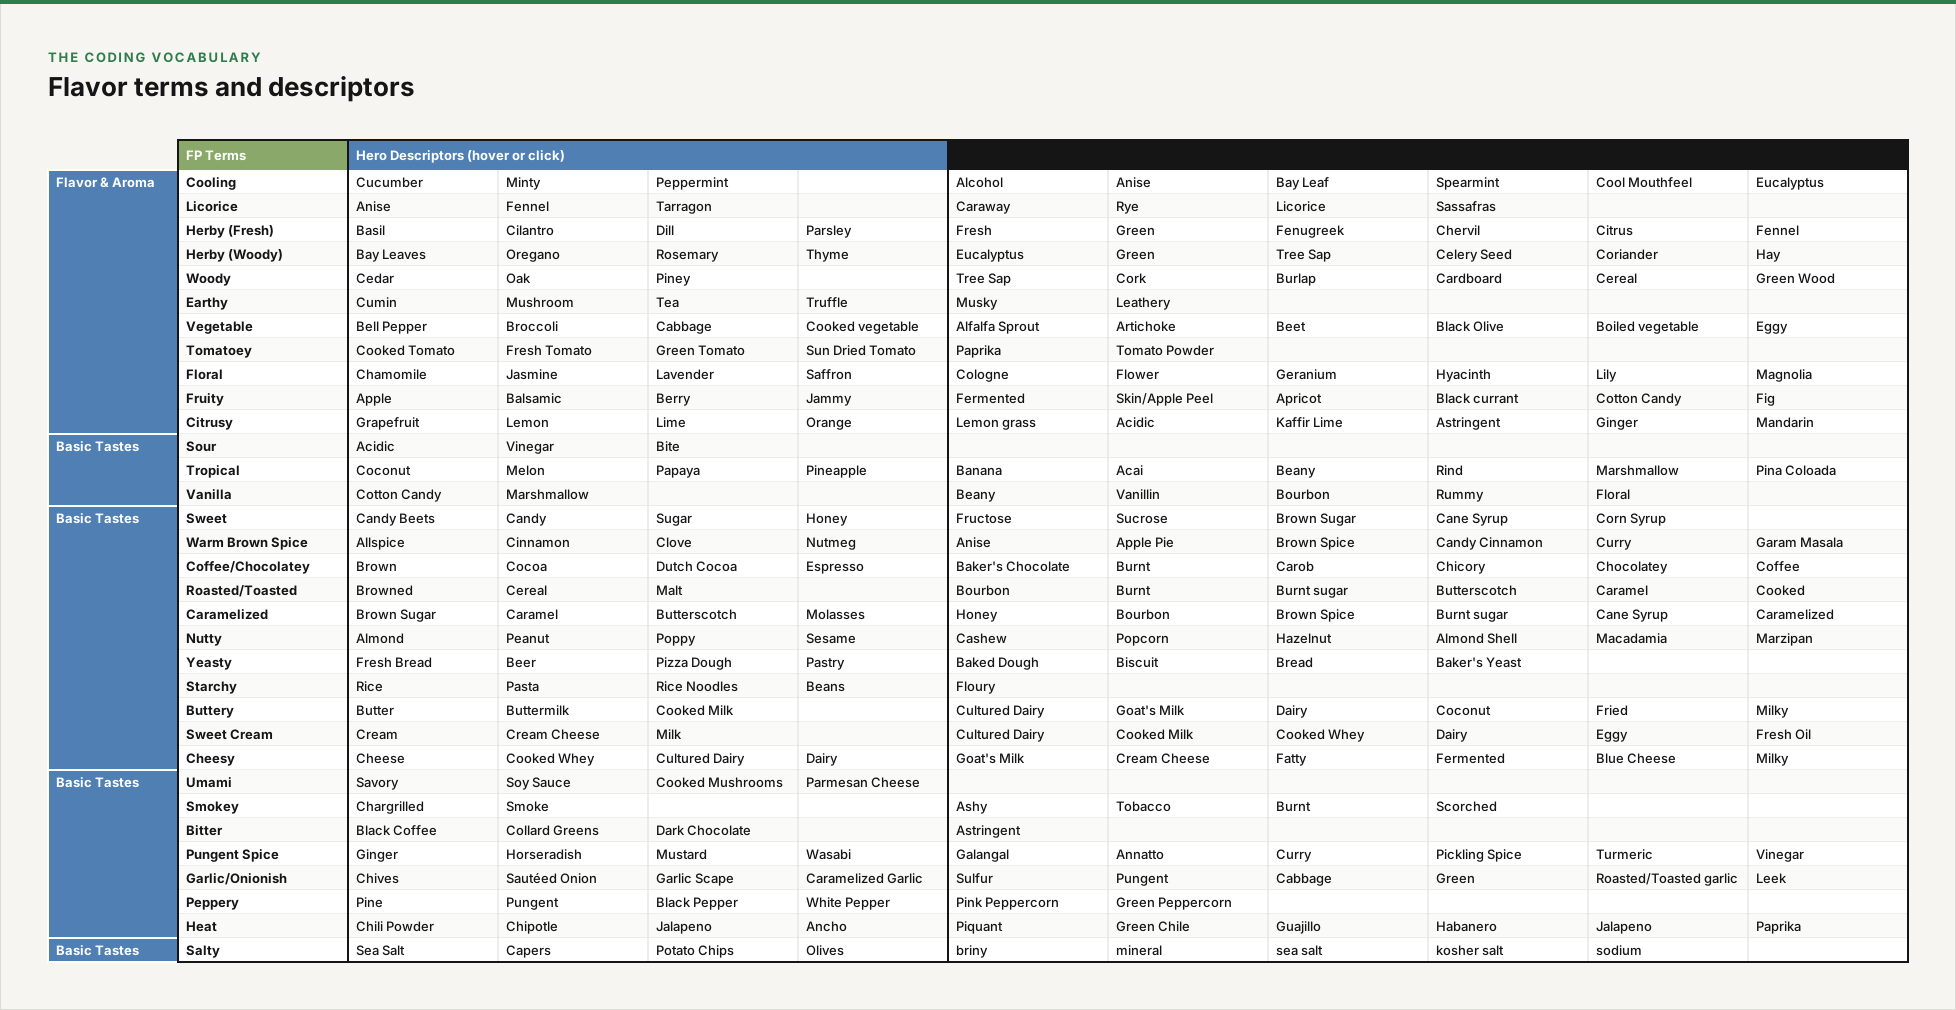
We began by building a model dataset. We consolidated the more than 400 flavors identified by McCormick’s food scientists into 30 key categories, then selected 100 sample recipes and coded each against those 30 flavors.
A visual language for taste
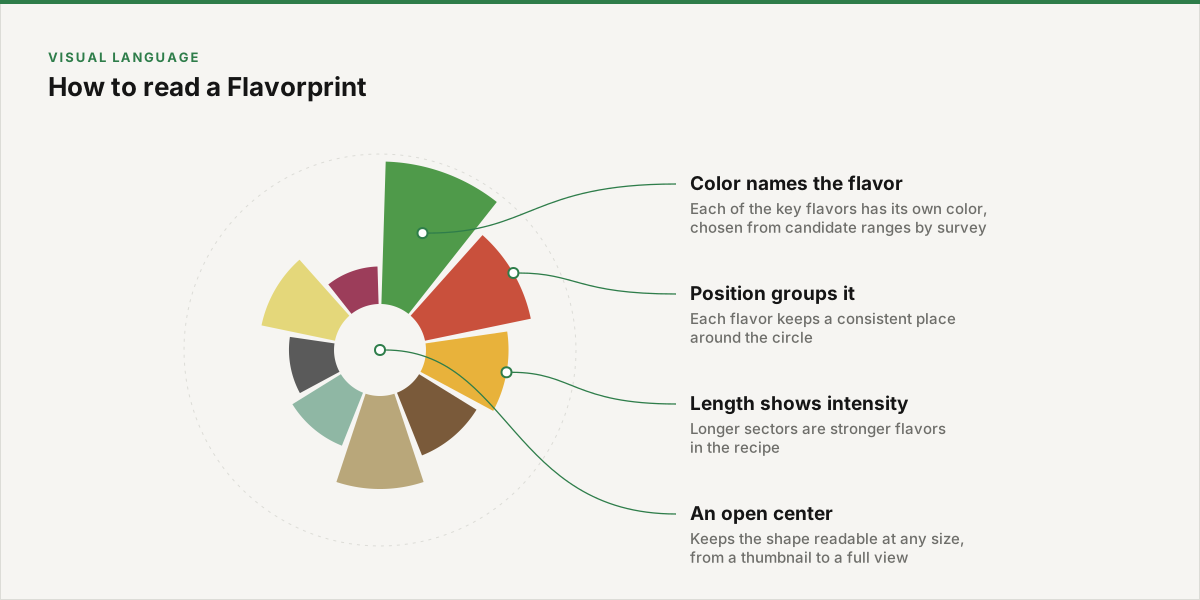
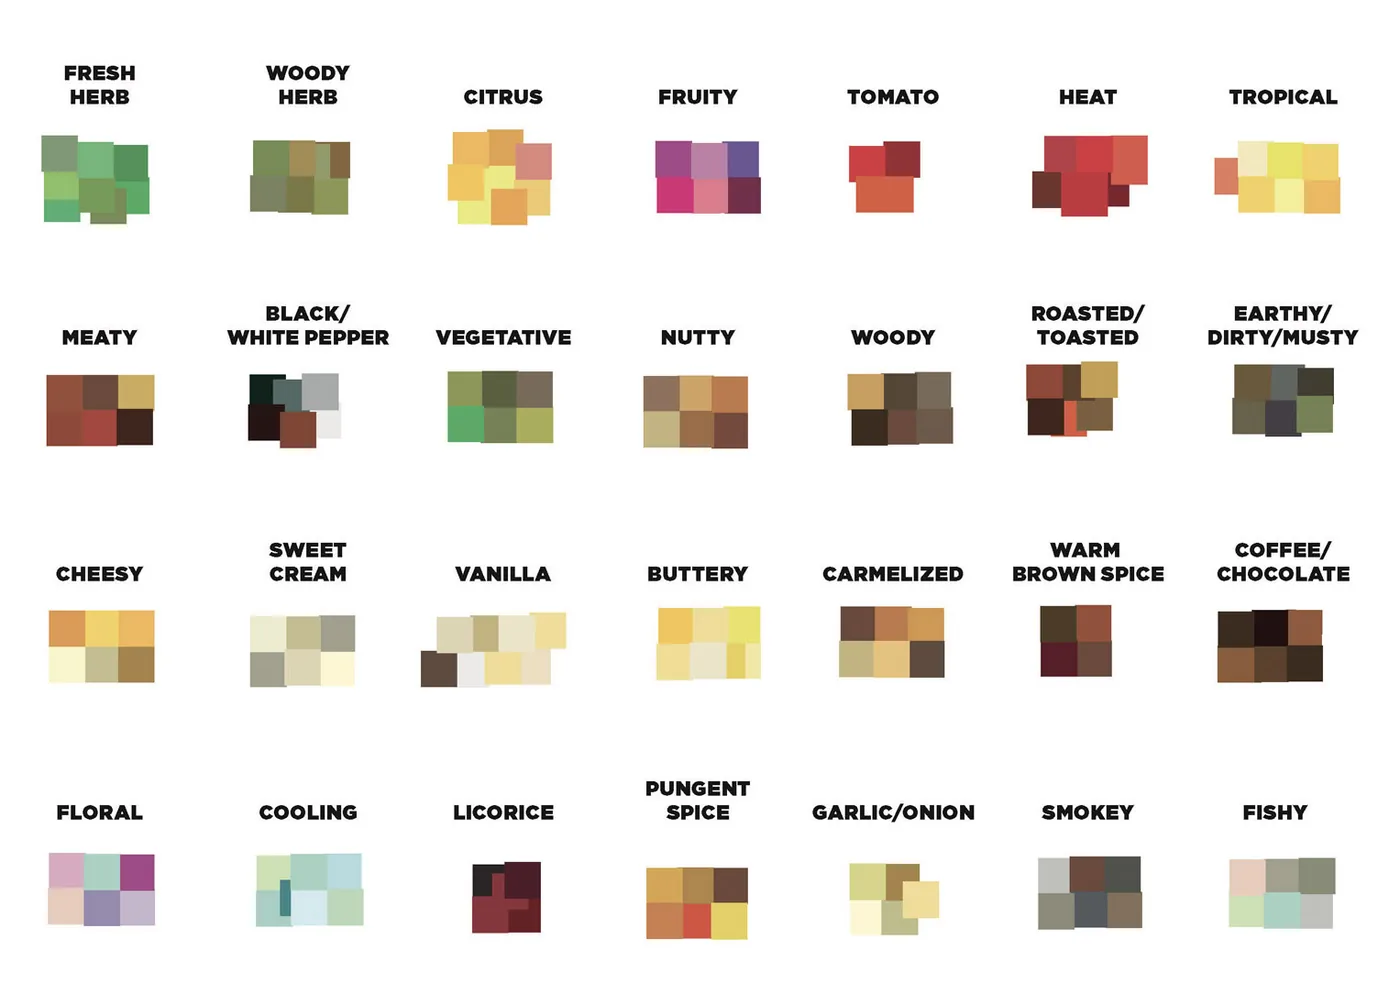
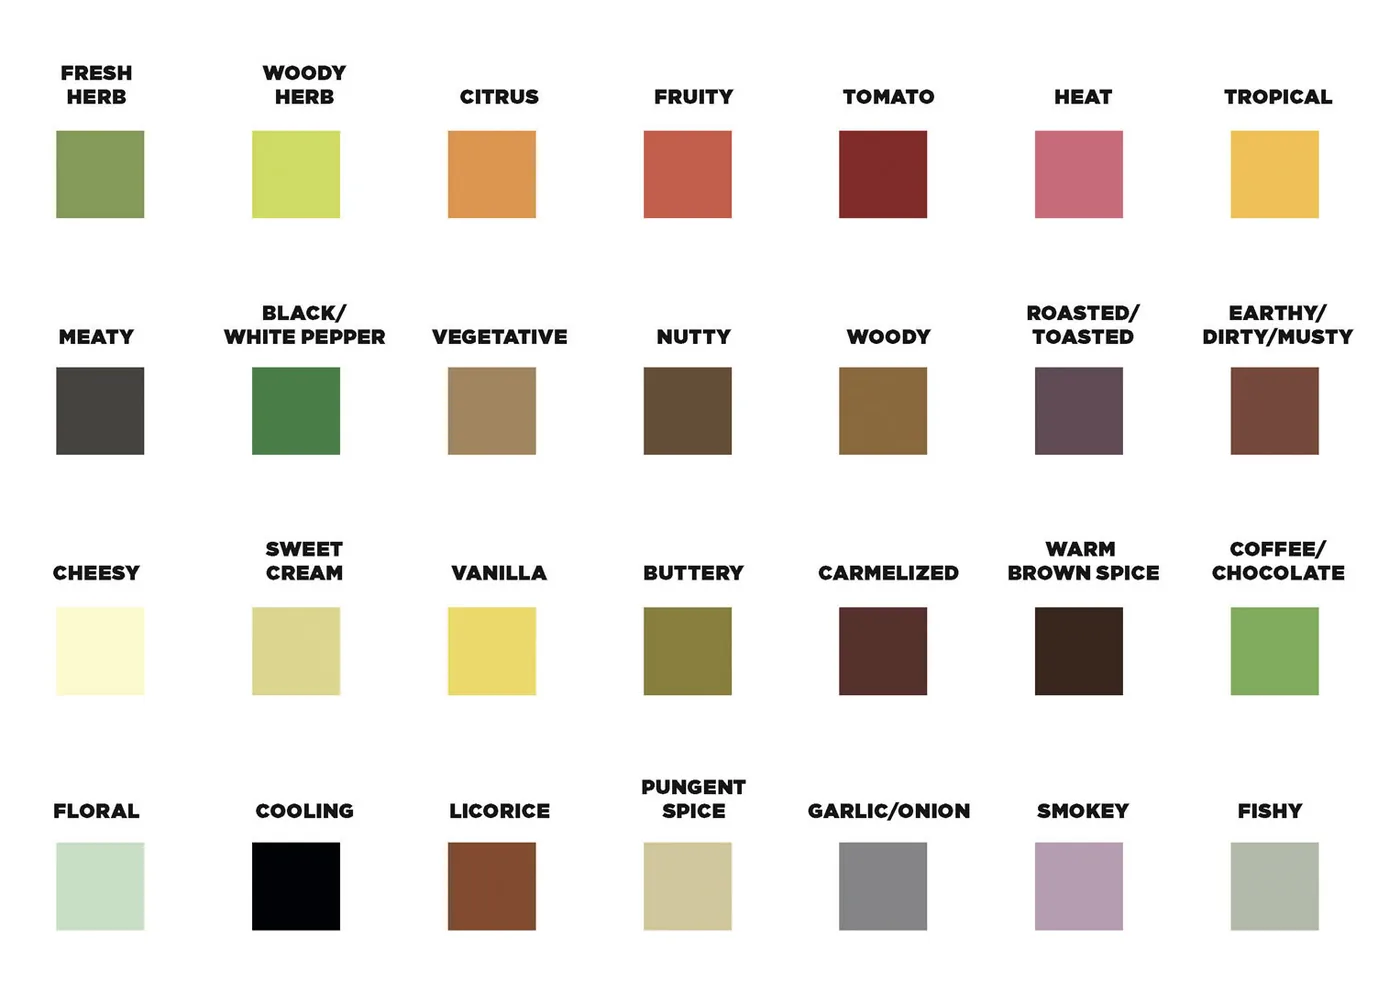
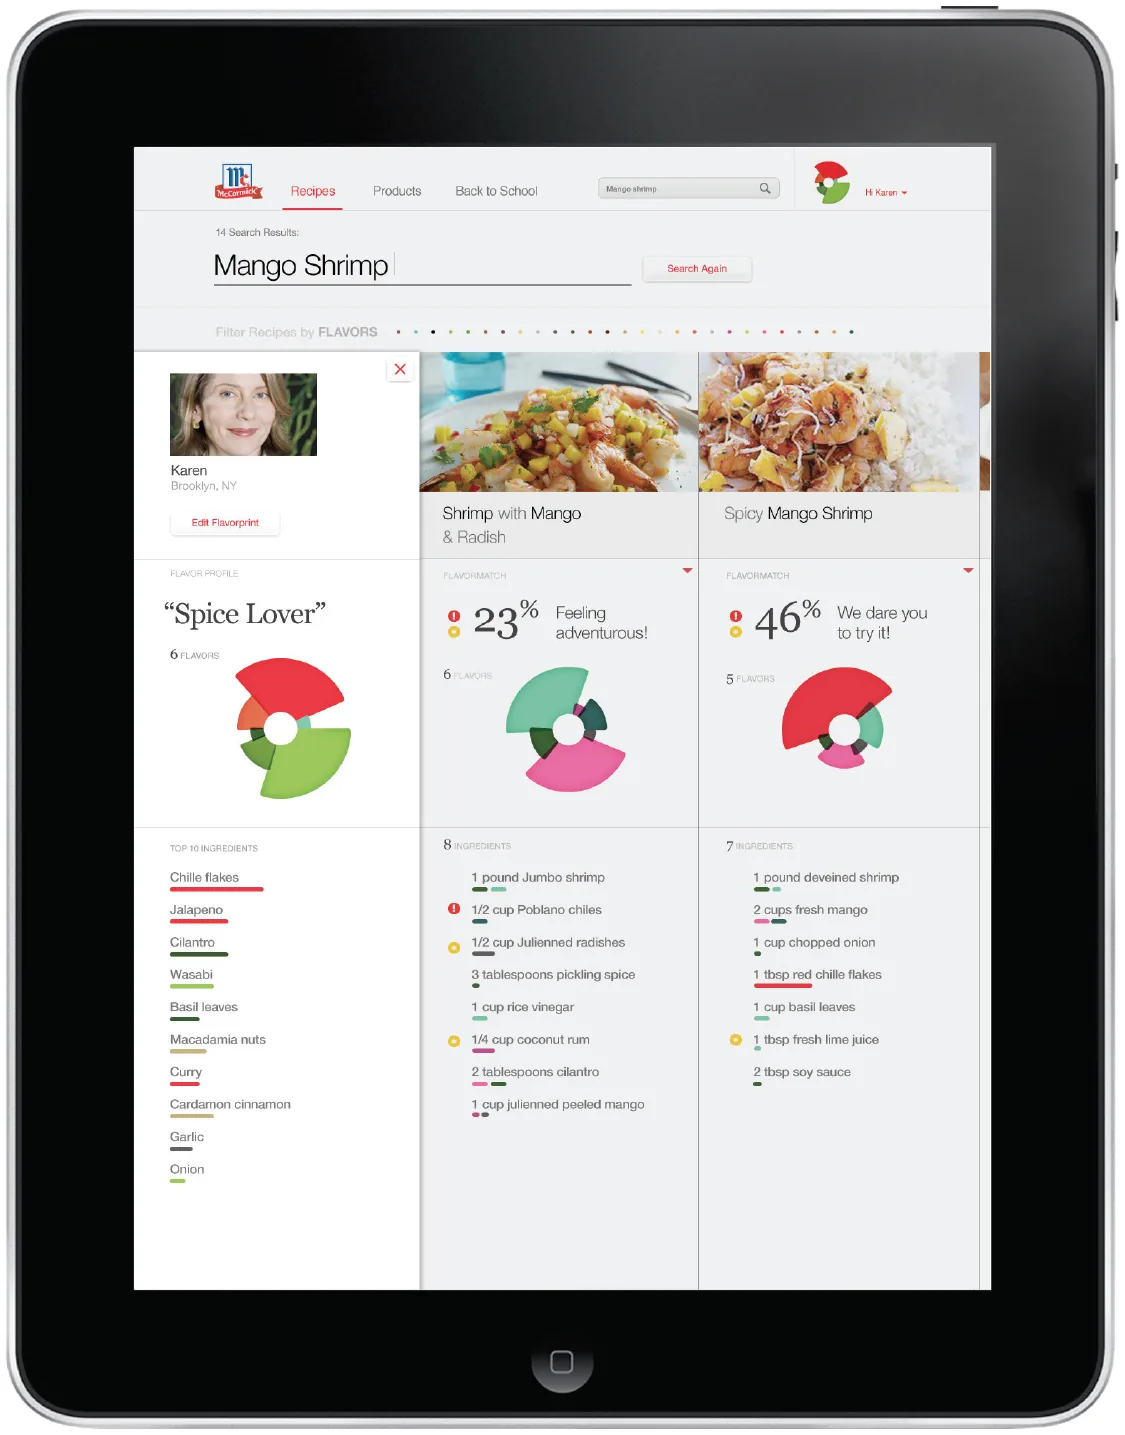
We chose a sector graph, a coxcomb diagram, as the core visualization: color and position identify each flavor, and sector length shows its intensity. One of the first questions was which color belongs to each flavor. We identified a range of candidate colors for every flavor and used a survey to choose the final palette.
Prototyping the system
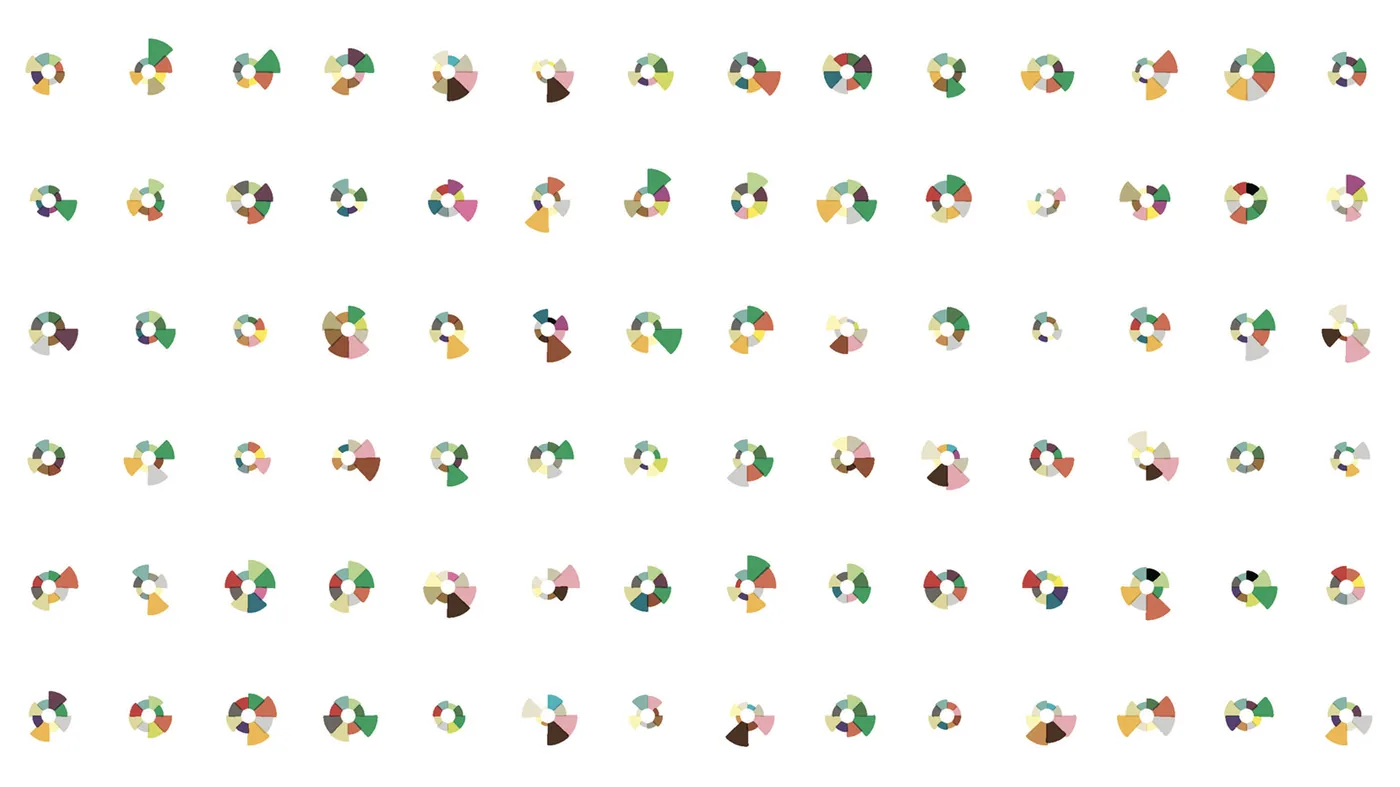
Many questions remained. How should the sectors scale? How large should the open center be? How would it render across JavaScript frameworks? We built a prototyping tool to explore the variations, then rendered recipe visualizations in large numbers to test their legibility side by side.
The right level of complexity
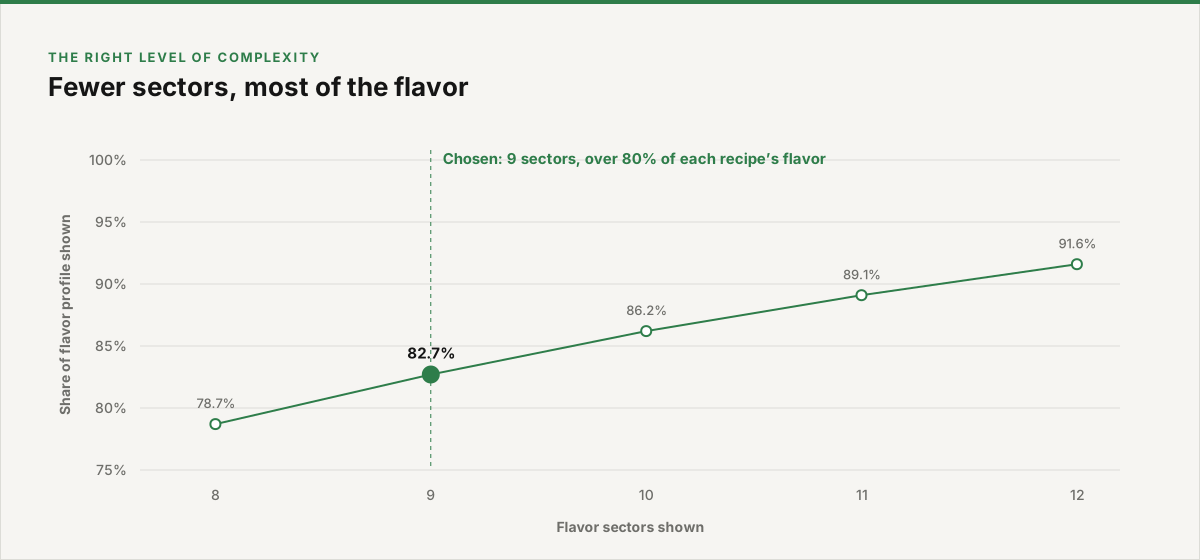
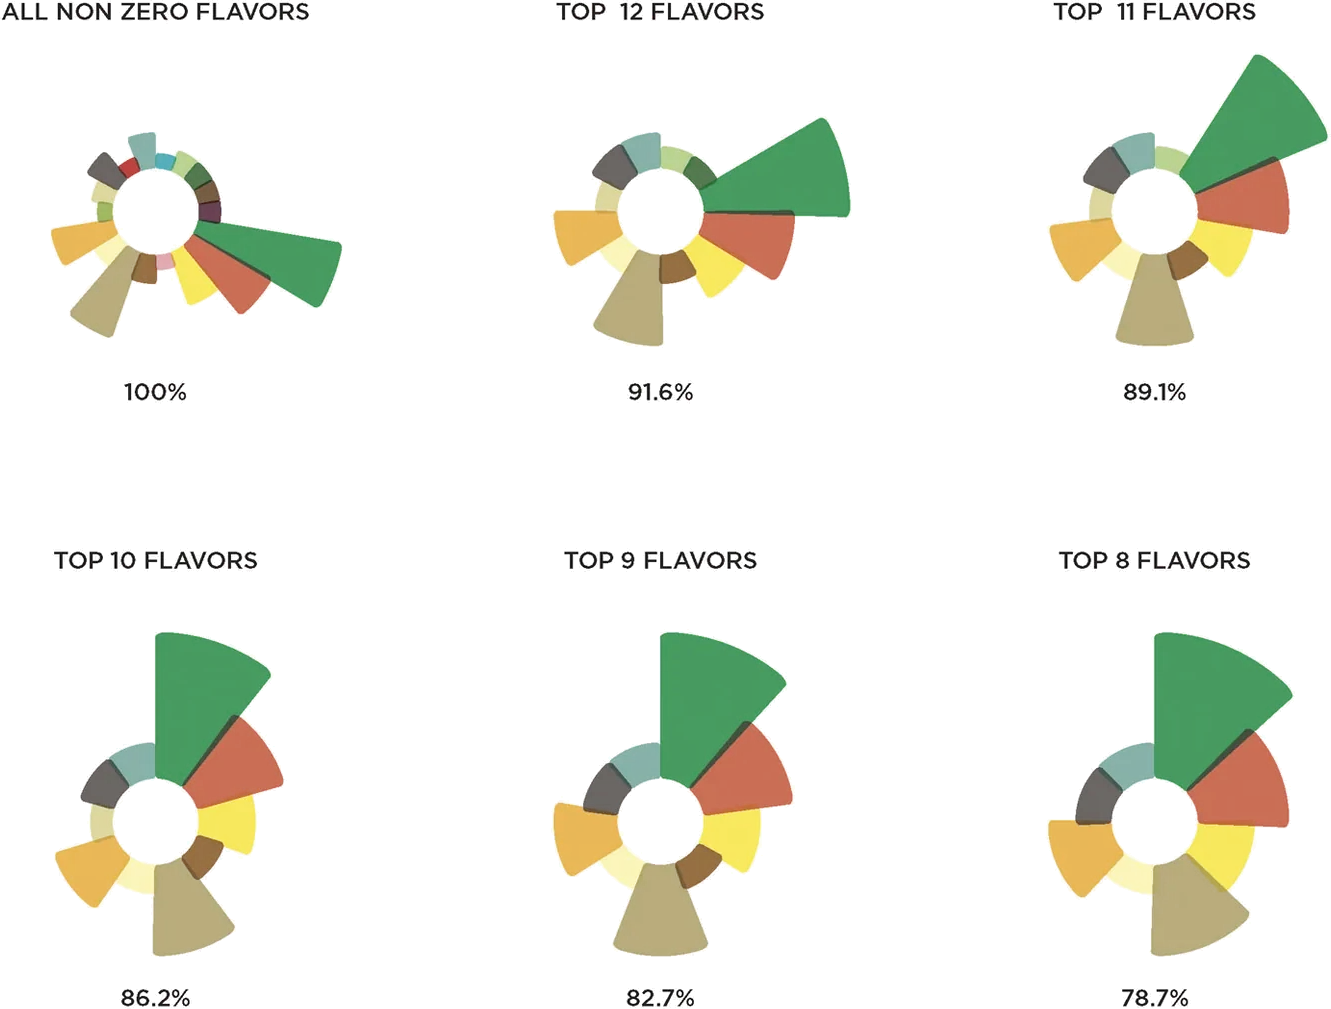
How many flavors to show was a key debate. All 30 made the graphic too busy, but the food scientists were uneasy with anything less than comprehensive. We analyzed flavors per recipe and showed how quickly the returns diminish as sectors are added. The team agreed on nine sectors, which cover more than 80 percent of the flavors in our recipes.
Beyond the visualization
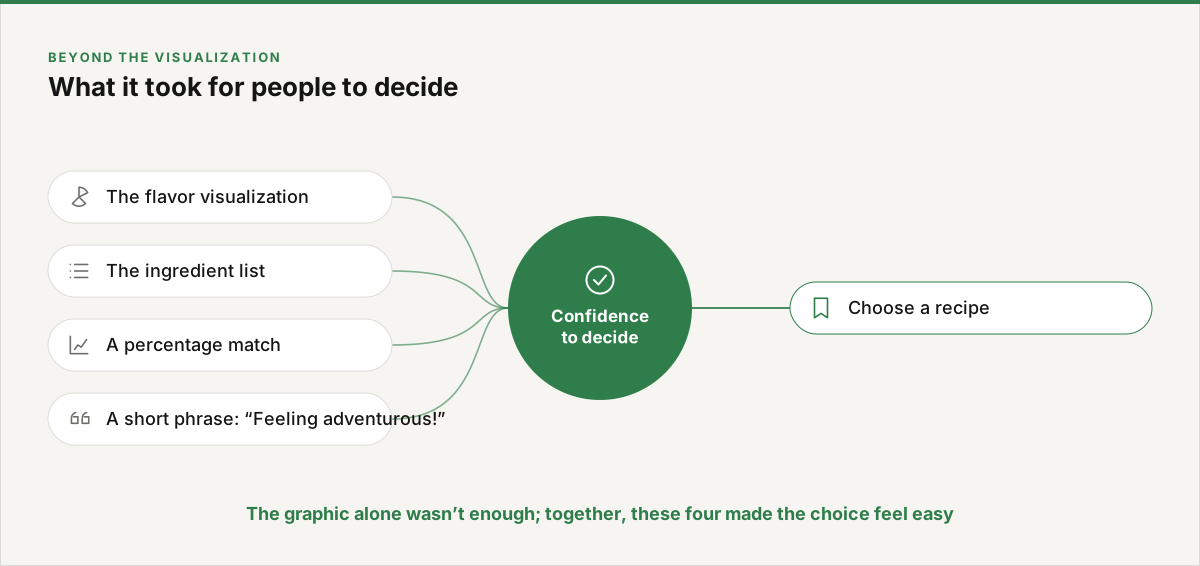
Testing showed that people valued the flavor graphic, but it wasn’t enough on its own to decide on a recipe. Combining the visualization with the ingredient list, a percentage match and a short phrase made people much more confident in their choice.

Key views
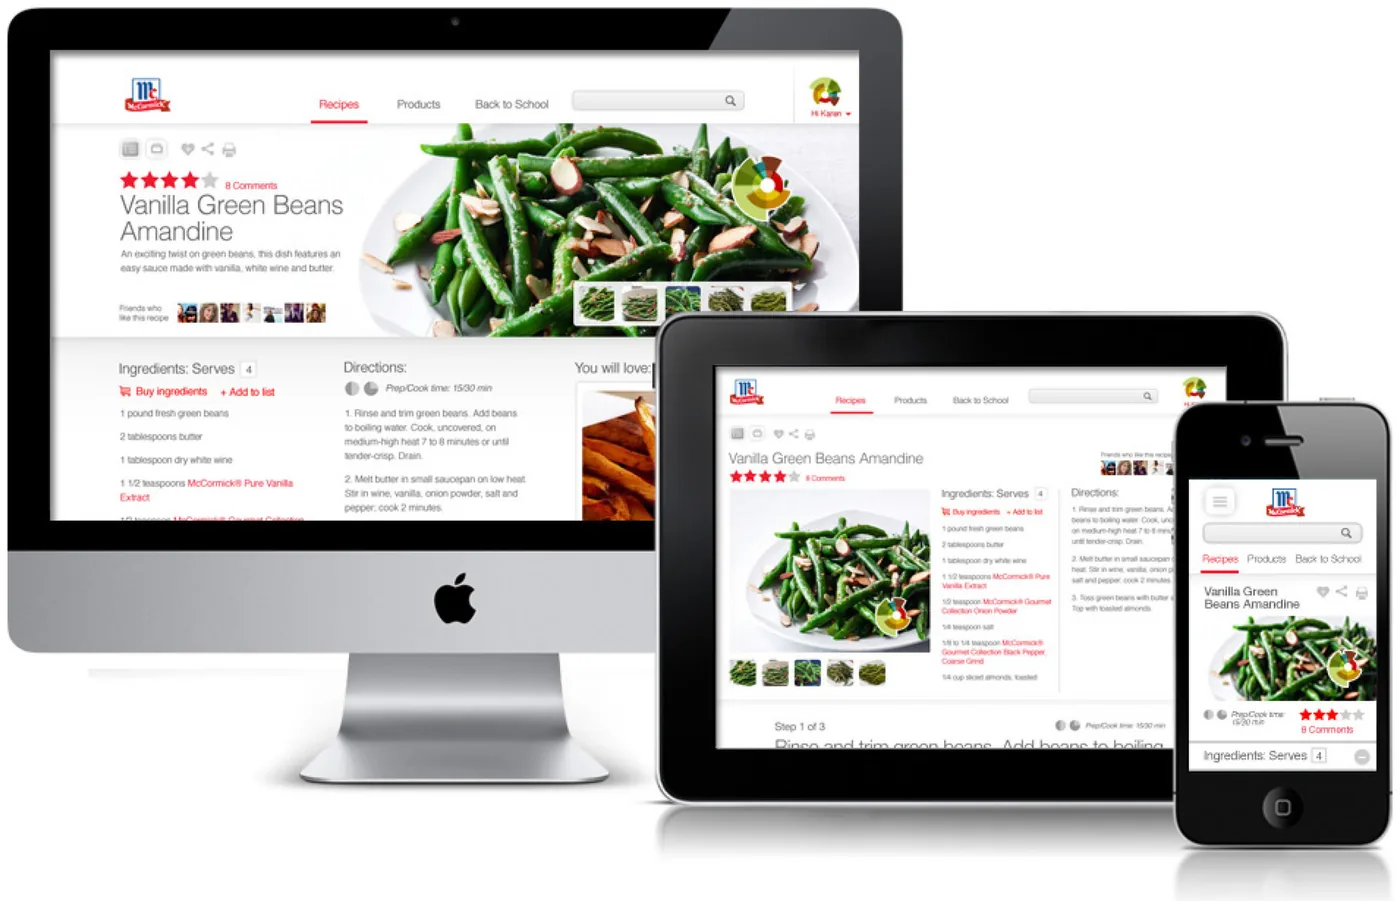
What it shows
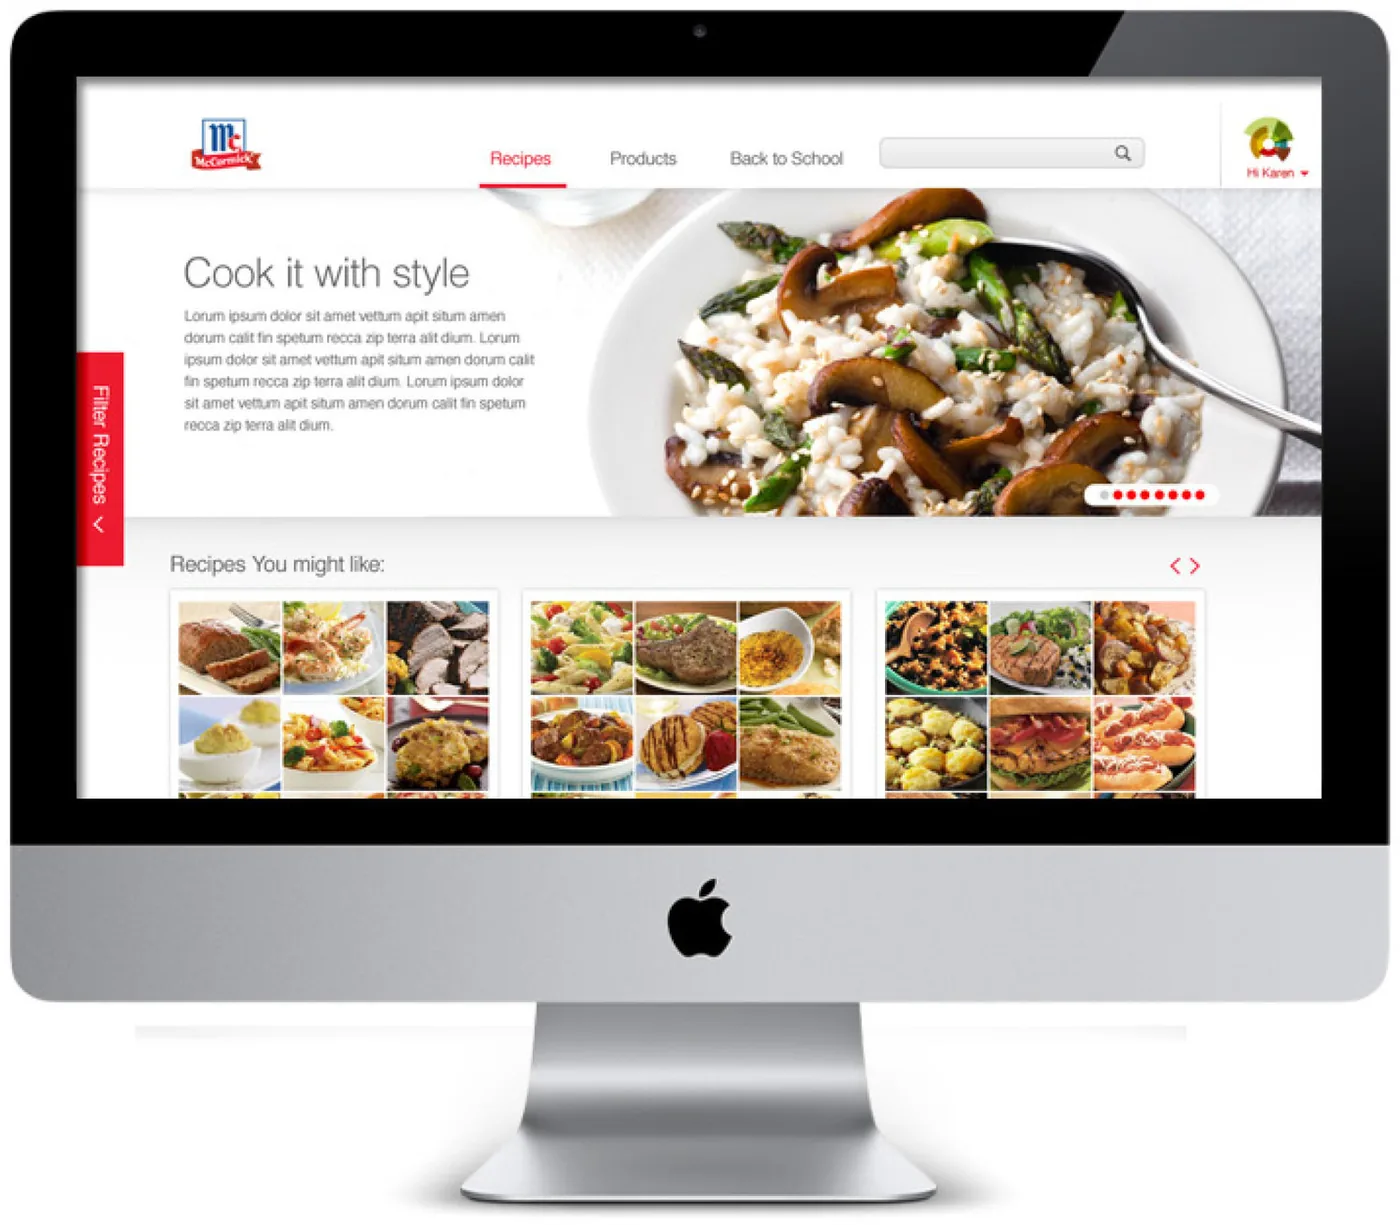
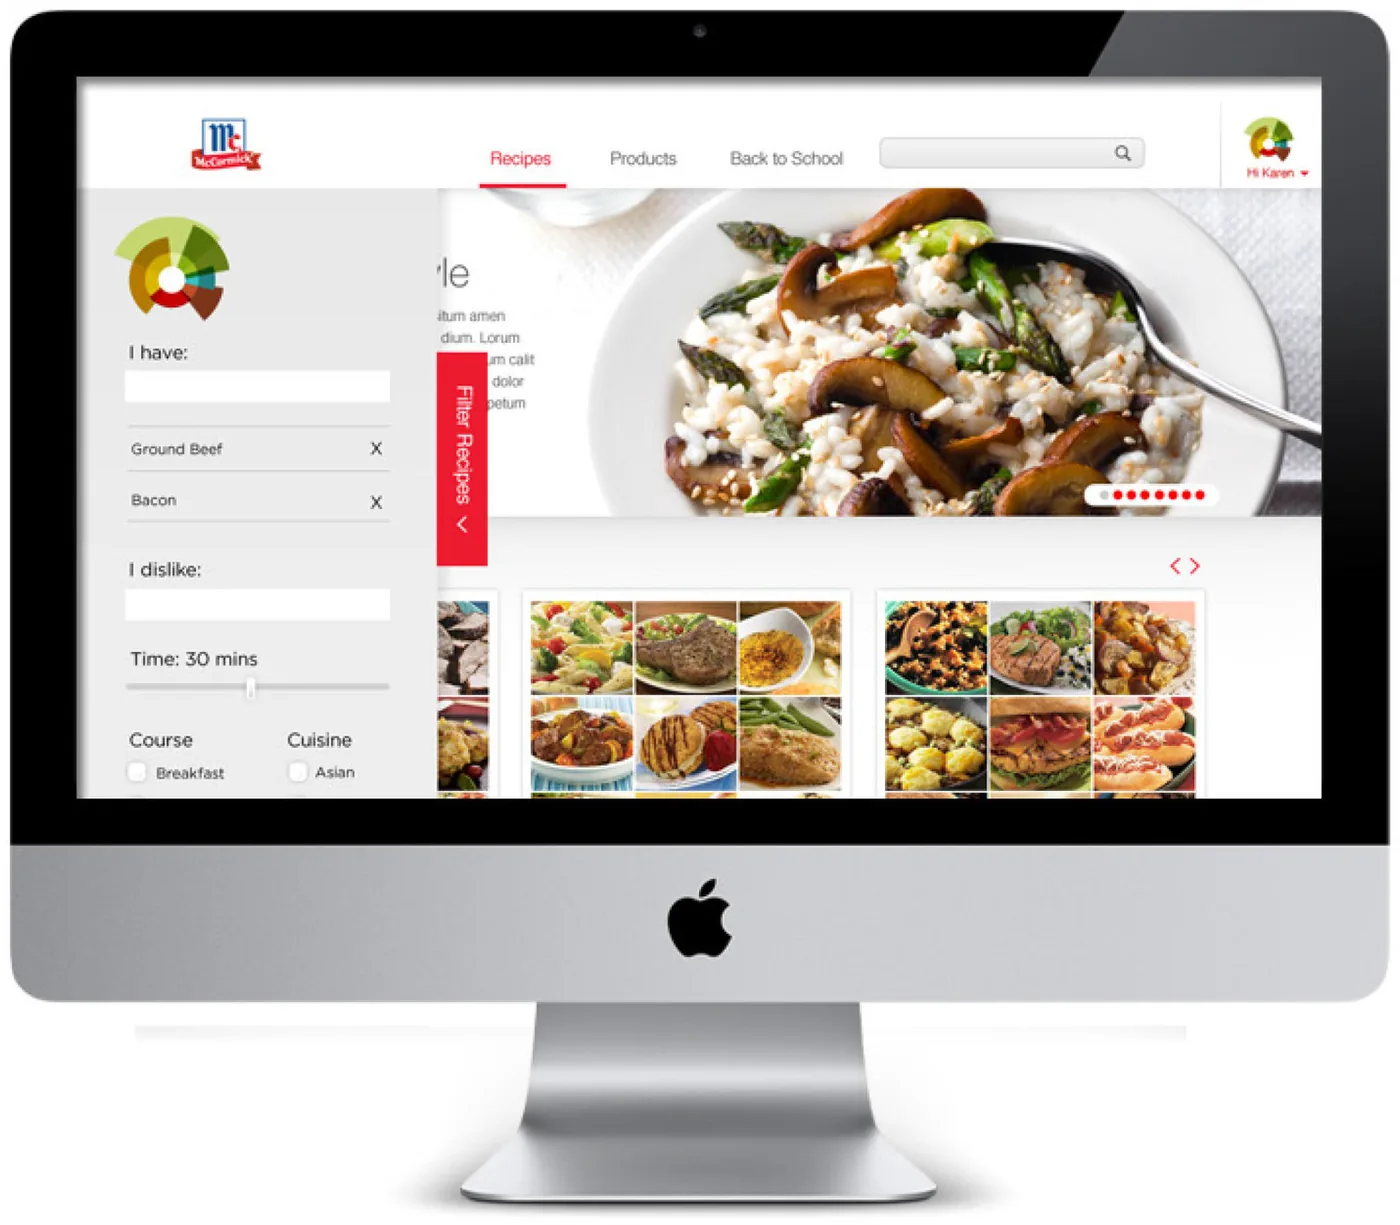
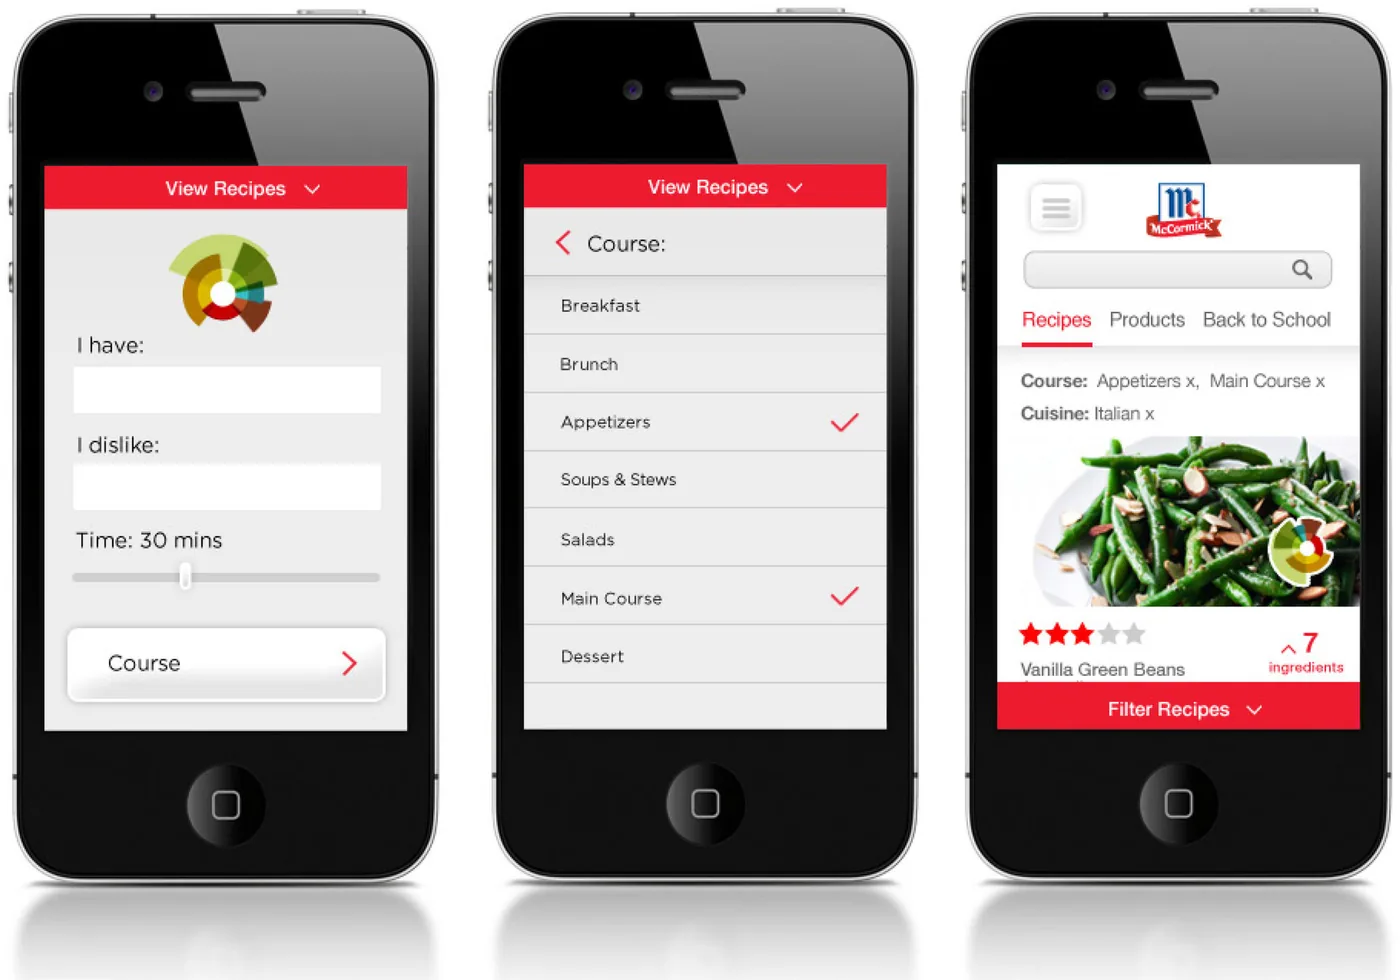
Flavorprint turned an internal scientific framework into an everyday tool: a visual system rigorous enough for food scientists and simple enough to read at a glance, designed through modeling, prototyping and testing rather than taste alone.